

Nanoparticle-based vaccine adjuvants for enhanced immune response
Researchers designed a new nanoparticle adjuvant that may be more potent than others now in use. Studies in mice showed it significantly improved antibody production following vaccination against HIV, diphtheria and influenza. Image: MIT News, iStockphoto
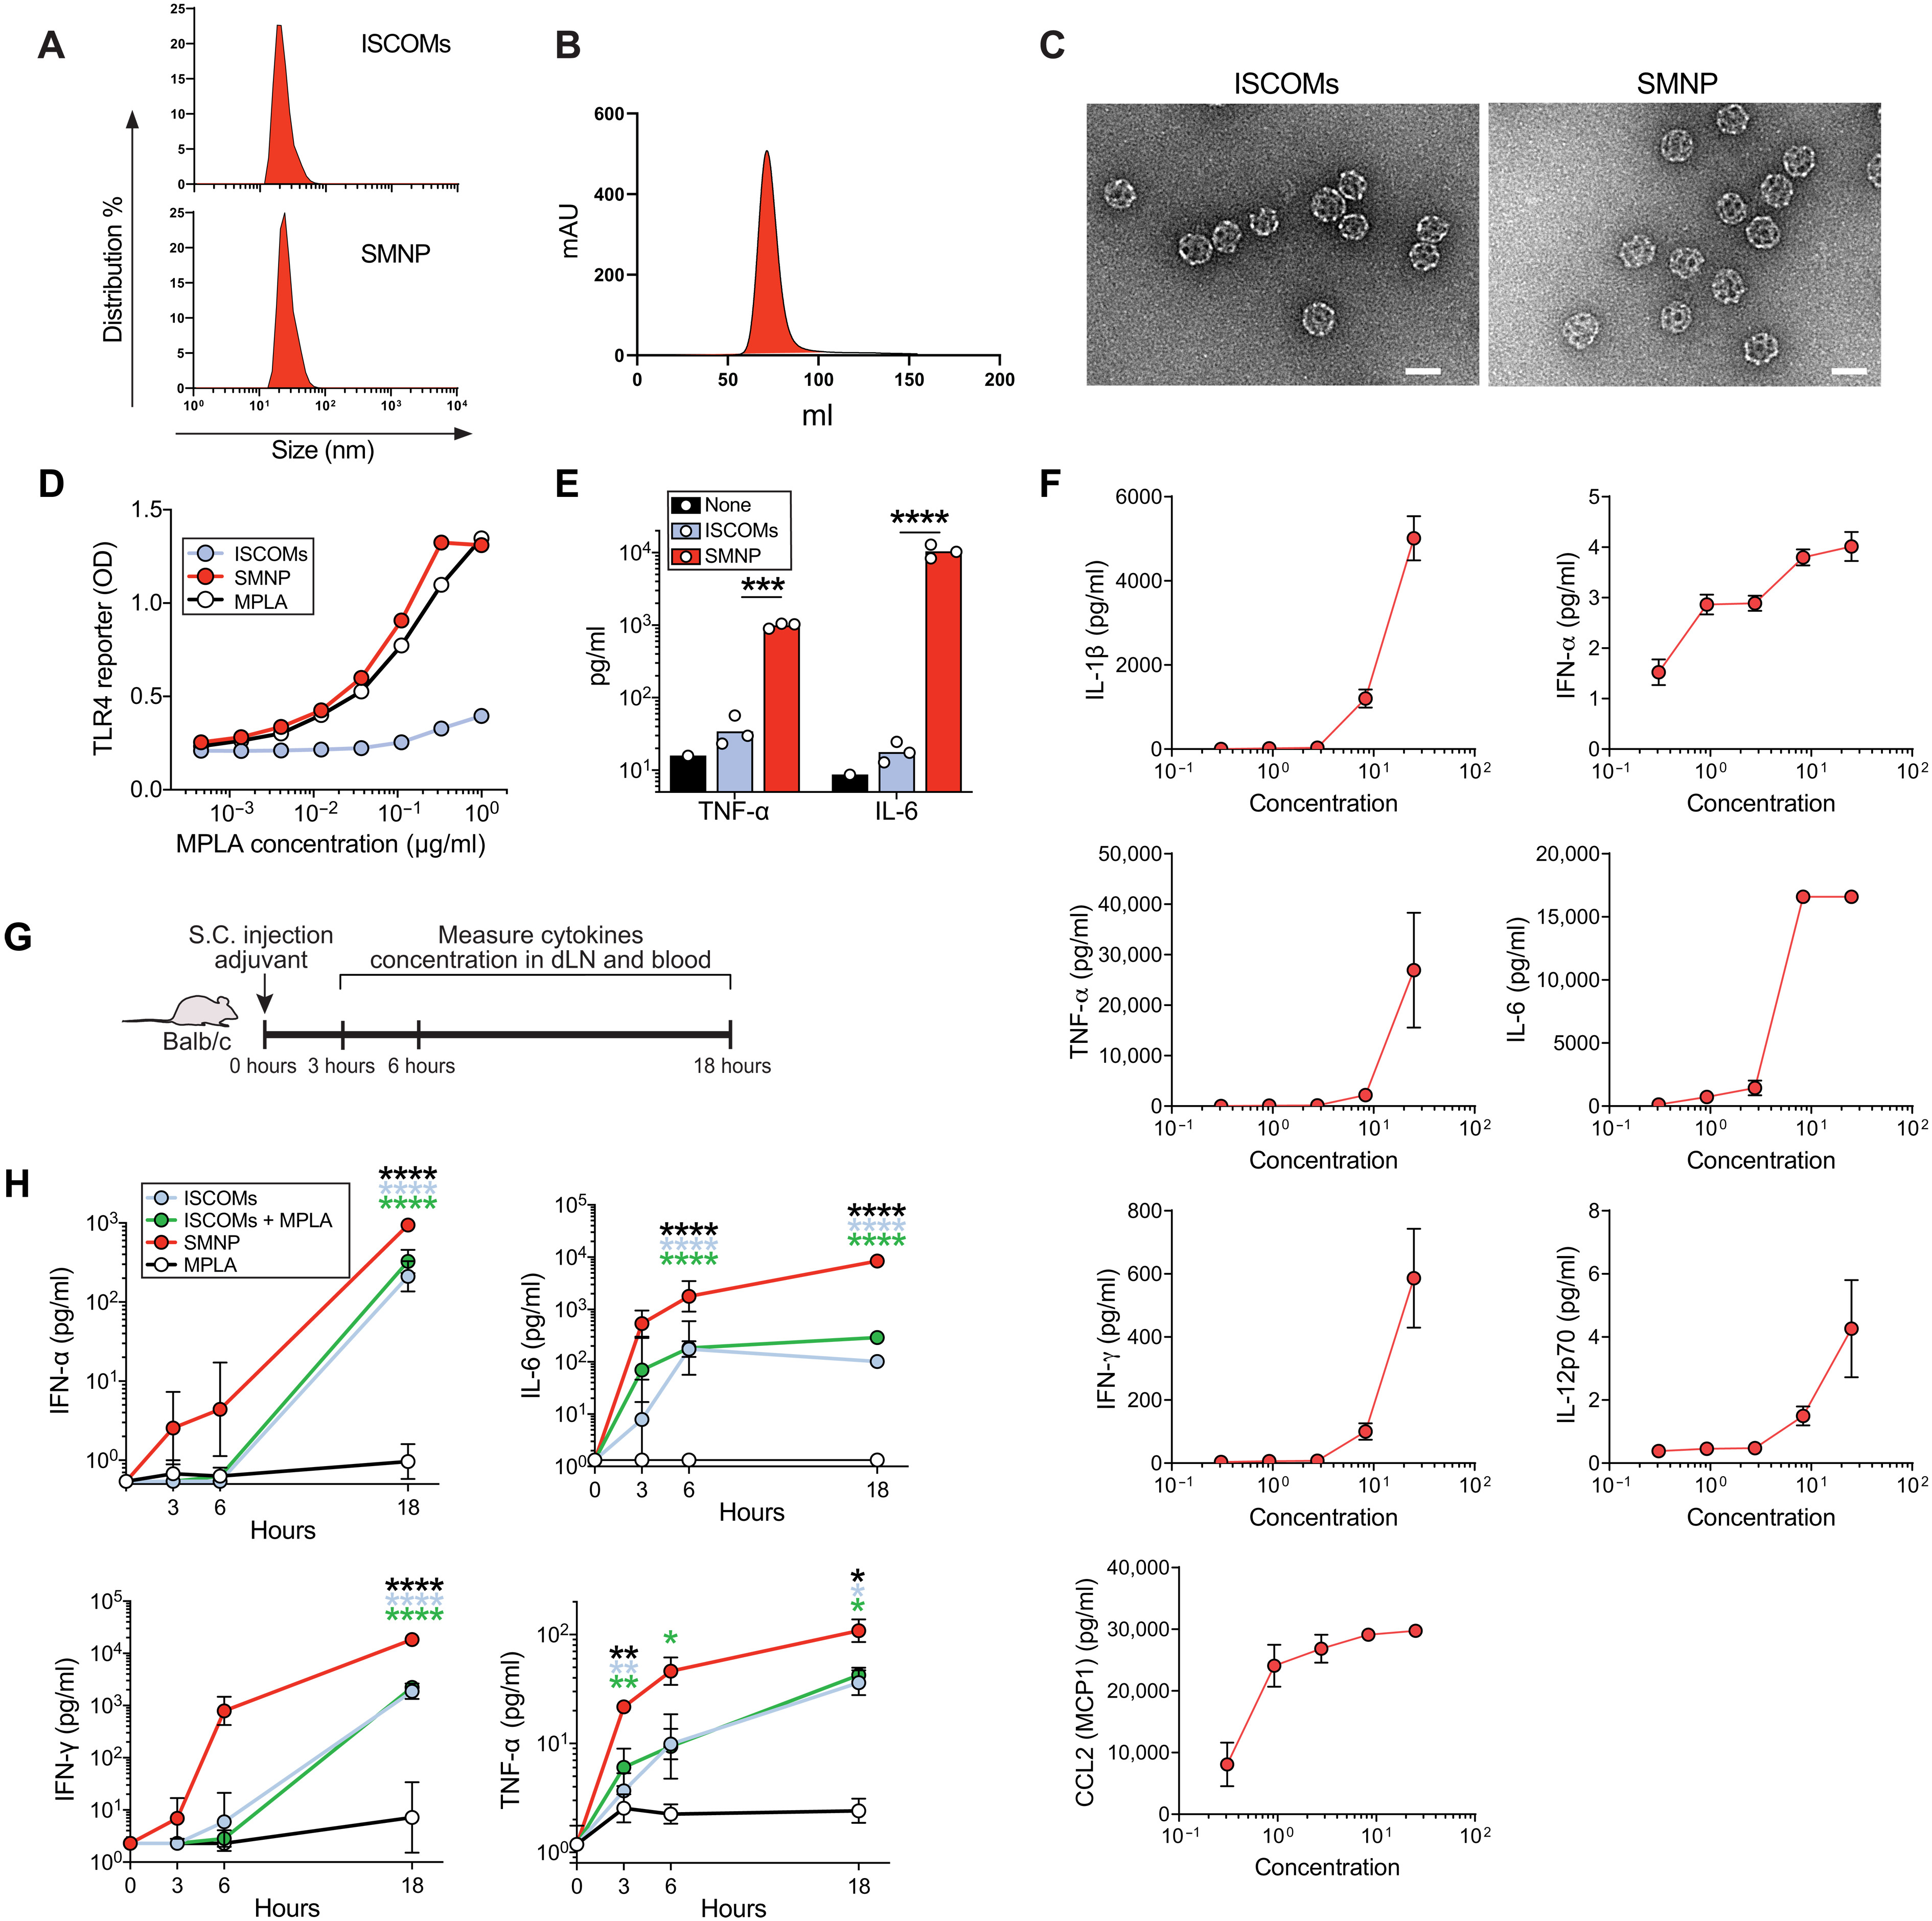
Fig. 1. Characterization of saponin-based nanoparticle adjuvants.
(A) DLS size measurements of ISCOMs and SMNP. (B) Size exclusion chromatogram of SMNP particles. (C) Representative TEM images of ISCOM and SMNP particles. Scale bars, 50 nm. (D) Activation analysis of RAW-Blue TLR reporter cell line after 18 hours of incubation with ISCOMS, SMNP, or free MPLA. ISCOMs were added at molar equivalent concentrations to SMNP as a control. Symbols represent mean values from duplicate wells. (E) Analysis of cytokine secretion by bone marrow–derived DCs 6 hours after incubation with SMNP (1 μg/ml) or ISCOMs (1 μg/ml). Each symbol represents a replicate well (n = 3), and the bar represents the mean. (F) SMNP was added at indicated concentrations to human PBMCs in vitro for 24 hours, followed by cytokine and chemokine analysis of the supernatant. Shown are means ± SEM. (G and H) Analysis of proinflammatory cytokine secretion in draining iLNs of mice at 3, 6, and 18 hours after adjuvant injection. Adjuvant was injected subcutaneously at the base of the tail in Balb/c mice. Representative data from two independent experiments (n = 3 mice per group). Shown are the experiment timeline (G) and mean cytokine concentrations at each time point (H). Symbols represent mean values. Error bars are SEMs. Statistical analysis for (E) was performed by one-way ANOVA, followed by Tukey’s post-test. Statistical analysis for (H) is comparing responses with SMNP using two-way ANOVA, followed by Dunnett’s post-test. *P < 0.05, **P < 0.01, ***P < 0.001, and ****P < 0.0001. S.C., subcutaneous. Image: Murillo Silva, et al., A particulate saponin/TLR agonist vaccine adjuvant alters lymph flow and modulates adaptive immunity.Sci. Immunol.6,eabf1152(2021).